Data scientist, engineer, and designer working on environmental tools at the intersection of machine learning / AI, UX, software engineering, policy, and natural science.
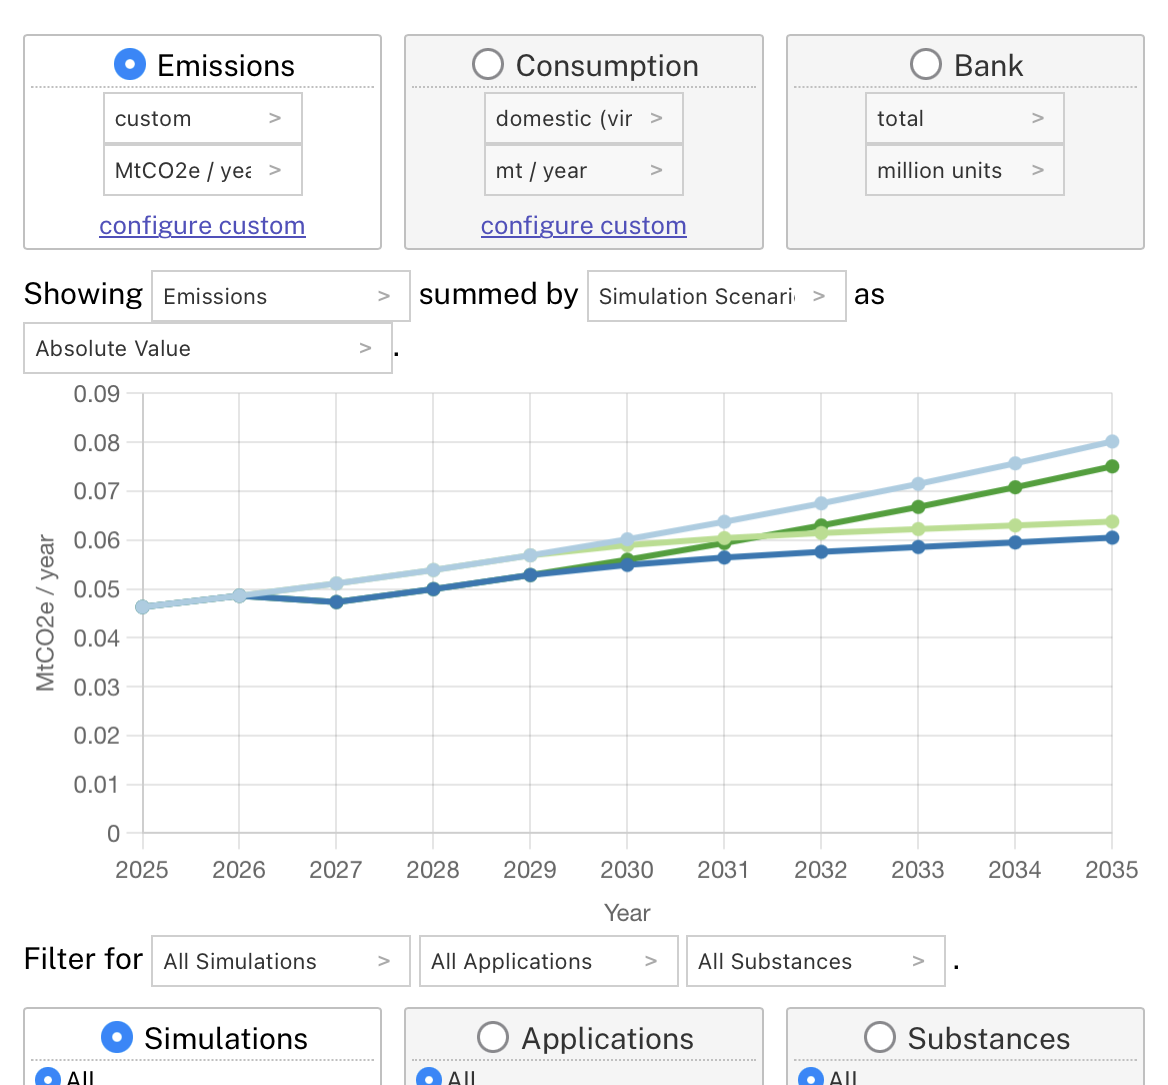
AI Plastics Tool
Interactive simulation of global plastics policies.
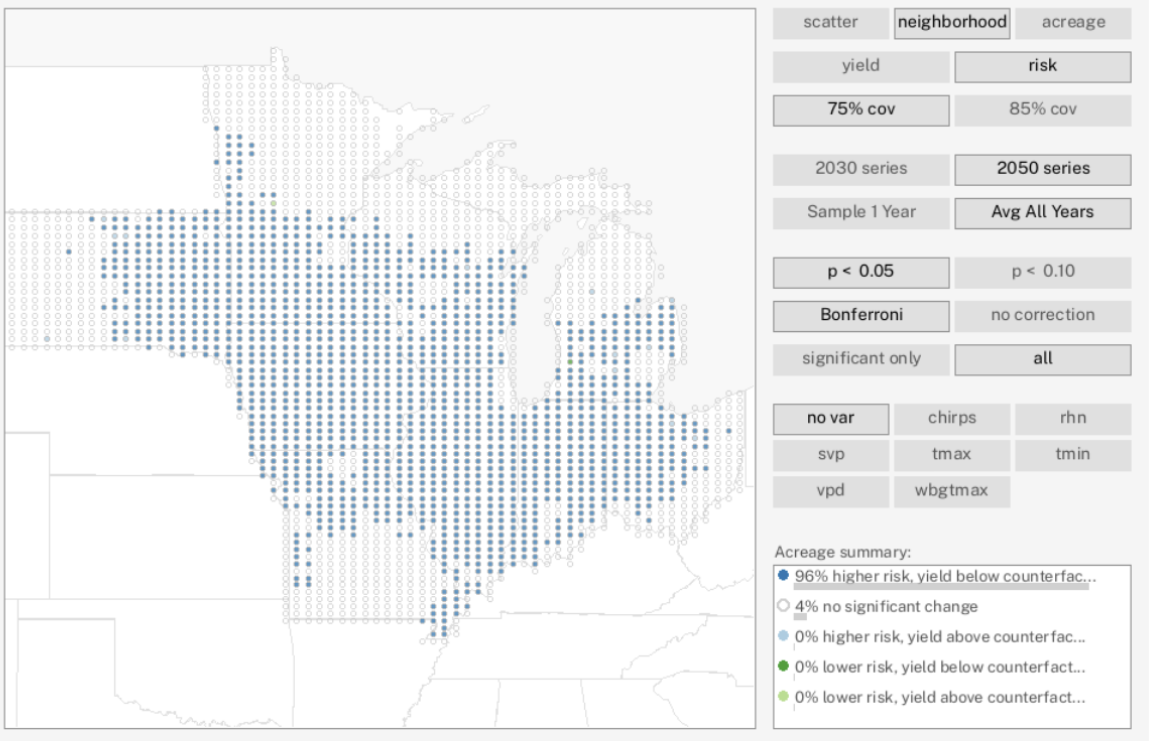
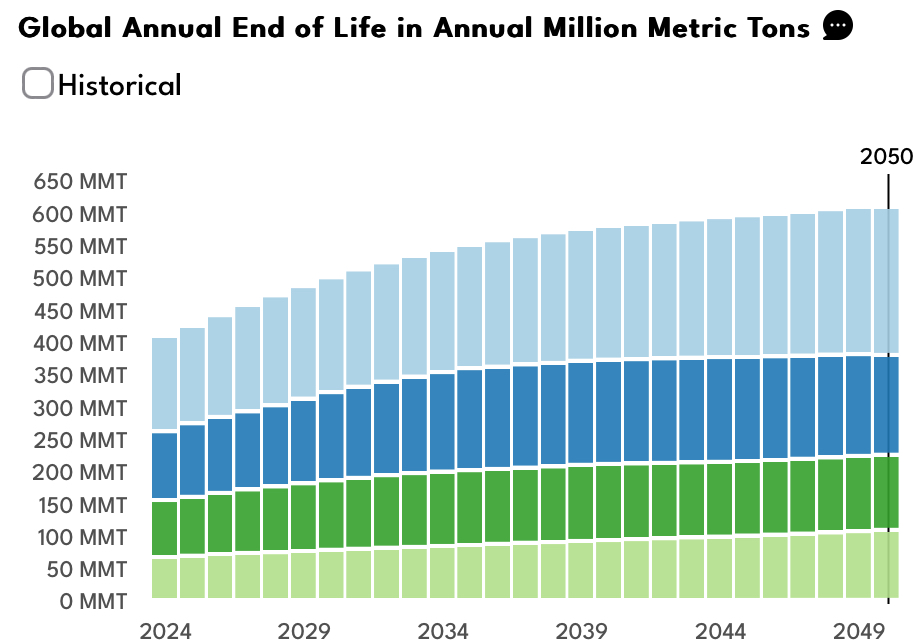
US Maize Insurance Study
Neural network Monte Carlo for US Crop Insurance
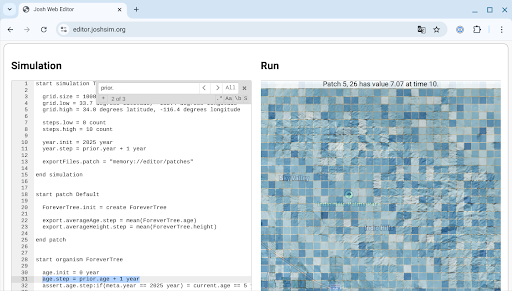
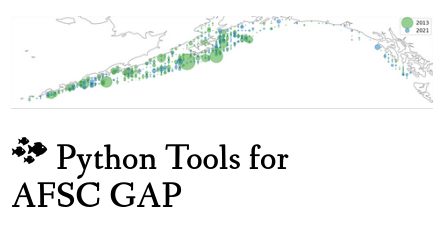
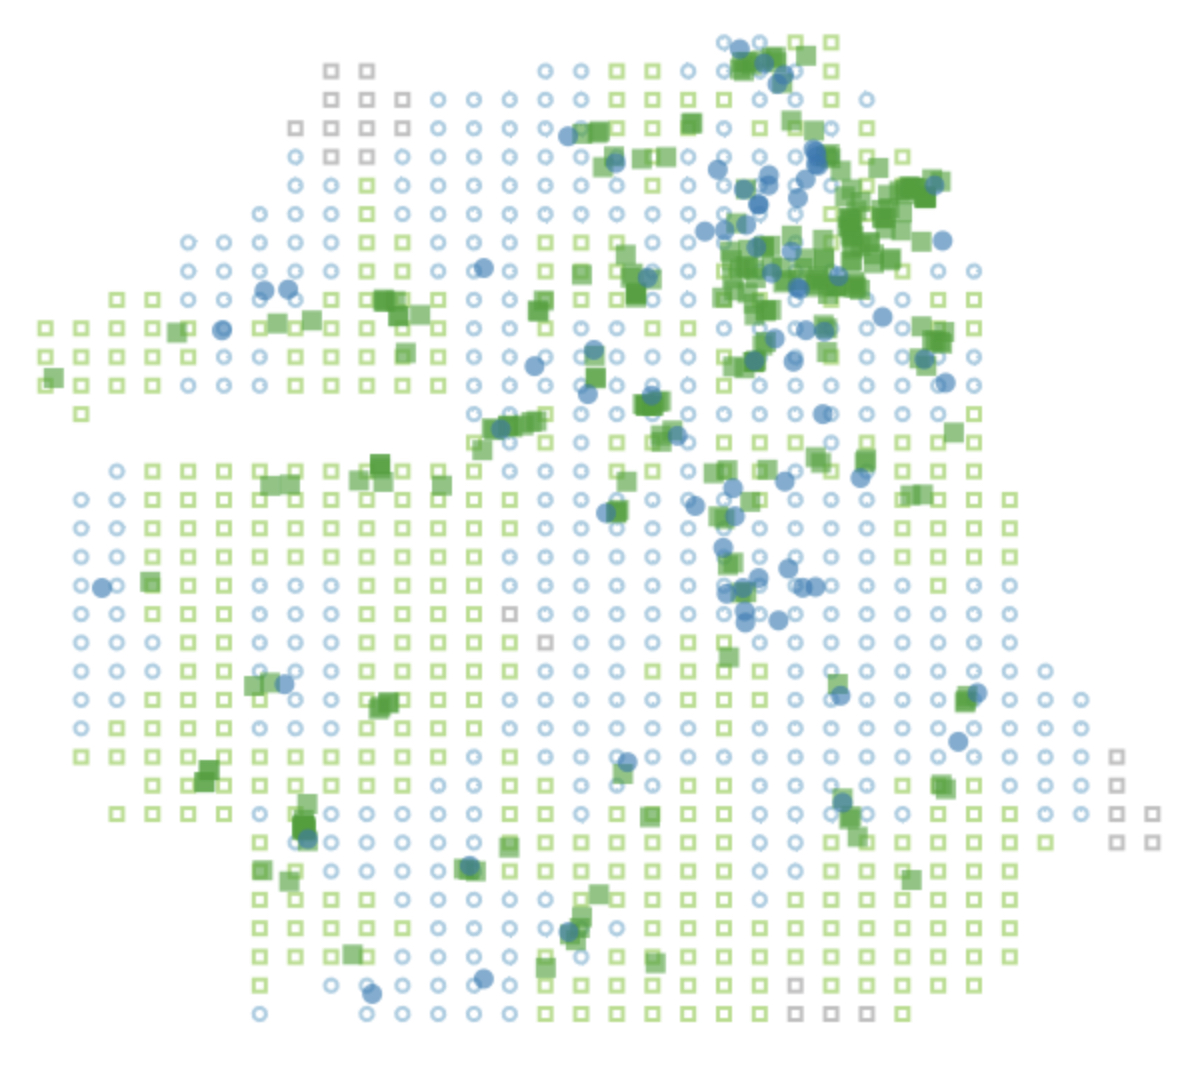
AFSC GAP
Open source Python-based tools for analyzing the NOAA AFSC GAP dataset.


SF Food Sim
Simulation of food access in San Francisco exploring data viz + data sci + game design.
Thinking through Viz Tools
How visualization tools embody different data viz philosophies and how those influence our work.
Data Driven Empathy
User centered data science and data visualization consulting.
Plenty
Data science, design, and software engineering for sustainable indoor agriculture

Data Science for System Design
Talk given to university systems design courses.
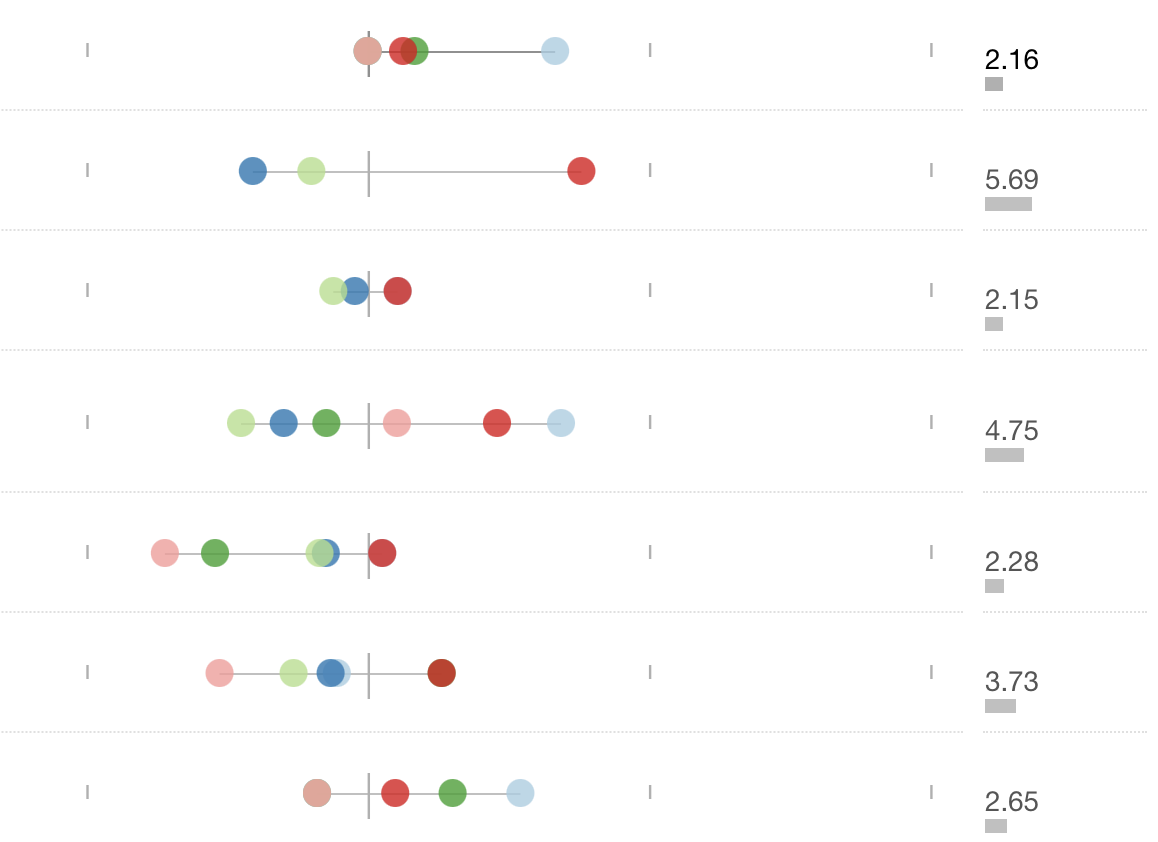
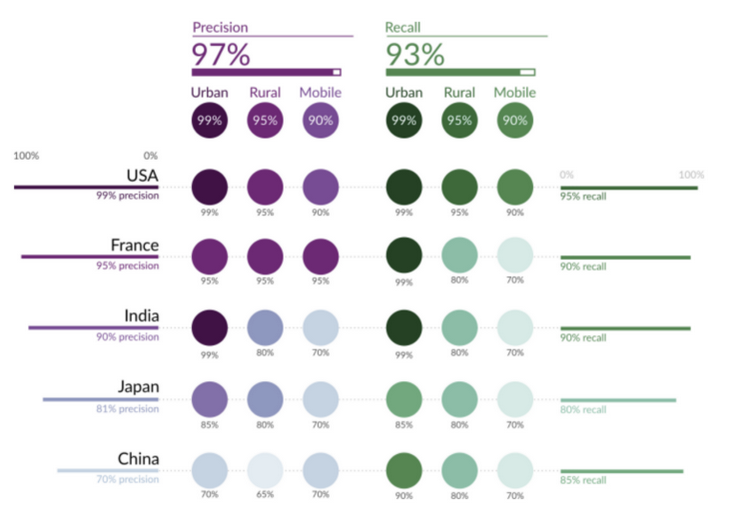
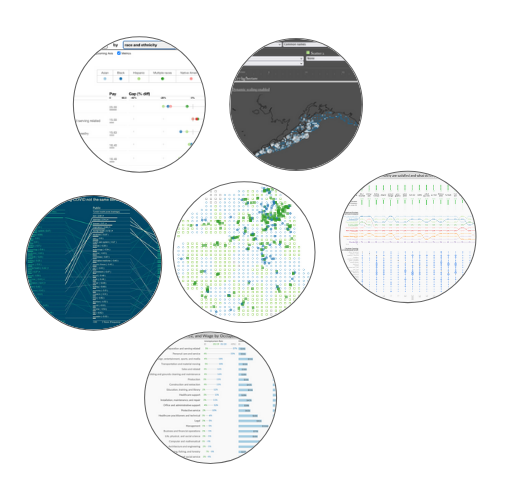
When Accuracy Isn't Enough
Visualization and game design for data science and machine learning.
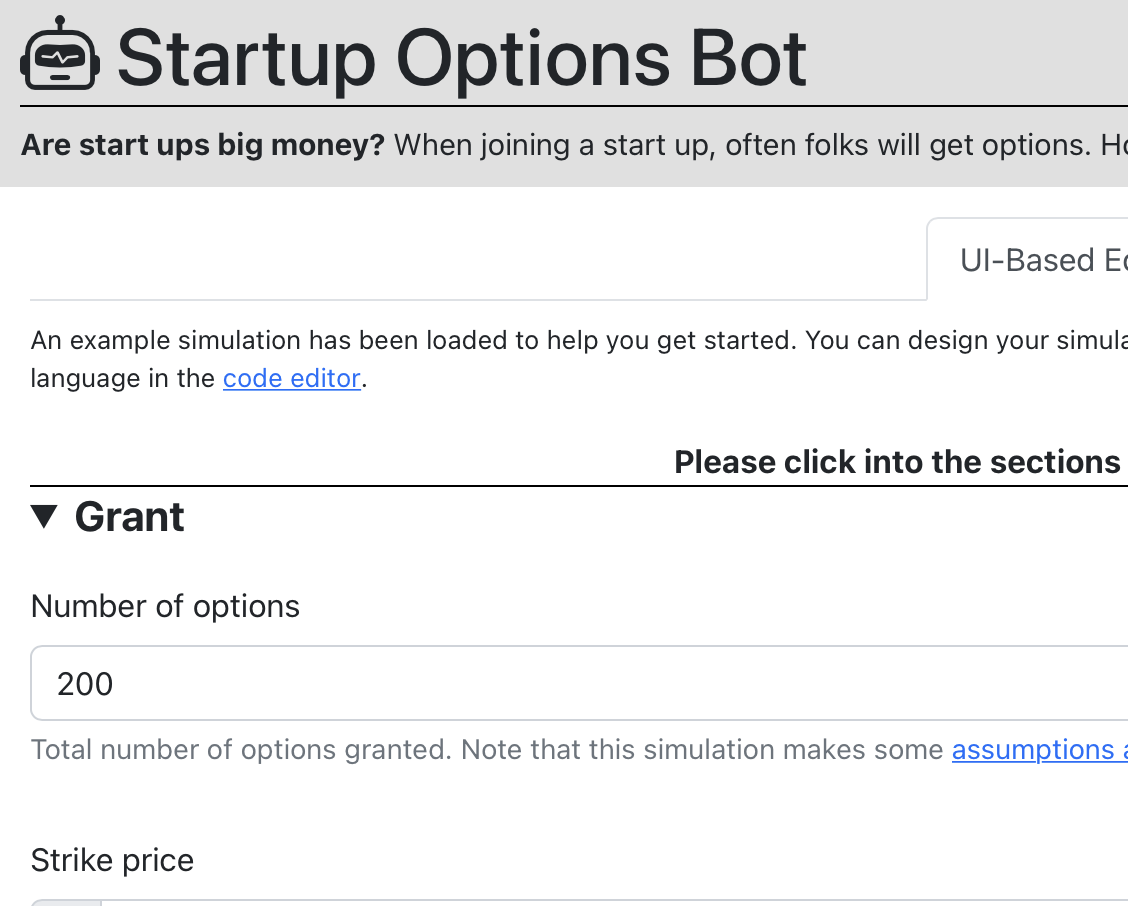
Startup Options Bot
Domains specific language and GUI for simulating options outcomes.

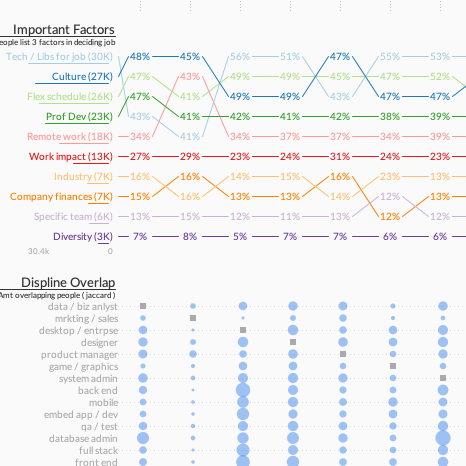
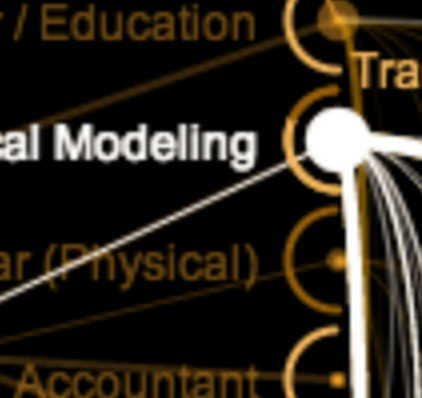
Satisfaction in Tech
What are the happiest jobs in tech? A data science-based investigation.
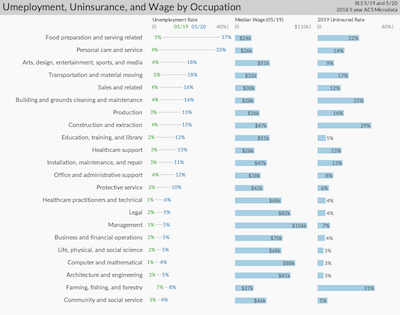
COVID Unemployment
Inequality and the Occupations with the Deepest Unemployment
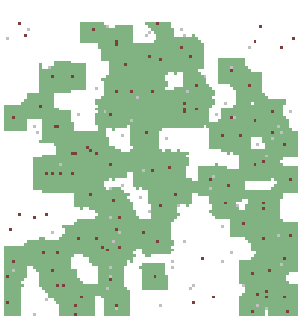
MCMC Slime Mold
HTML5 canvas / JavaScript model of slime mold and how it creates awesome optimized networks.
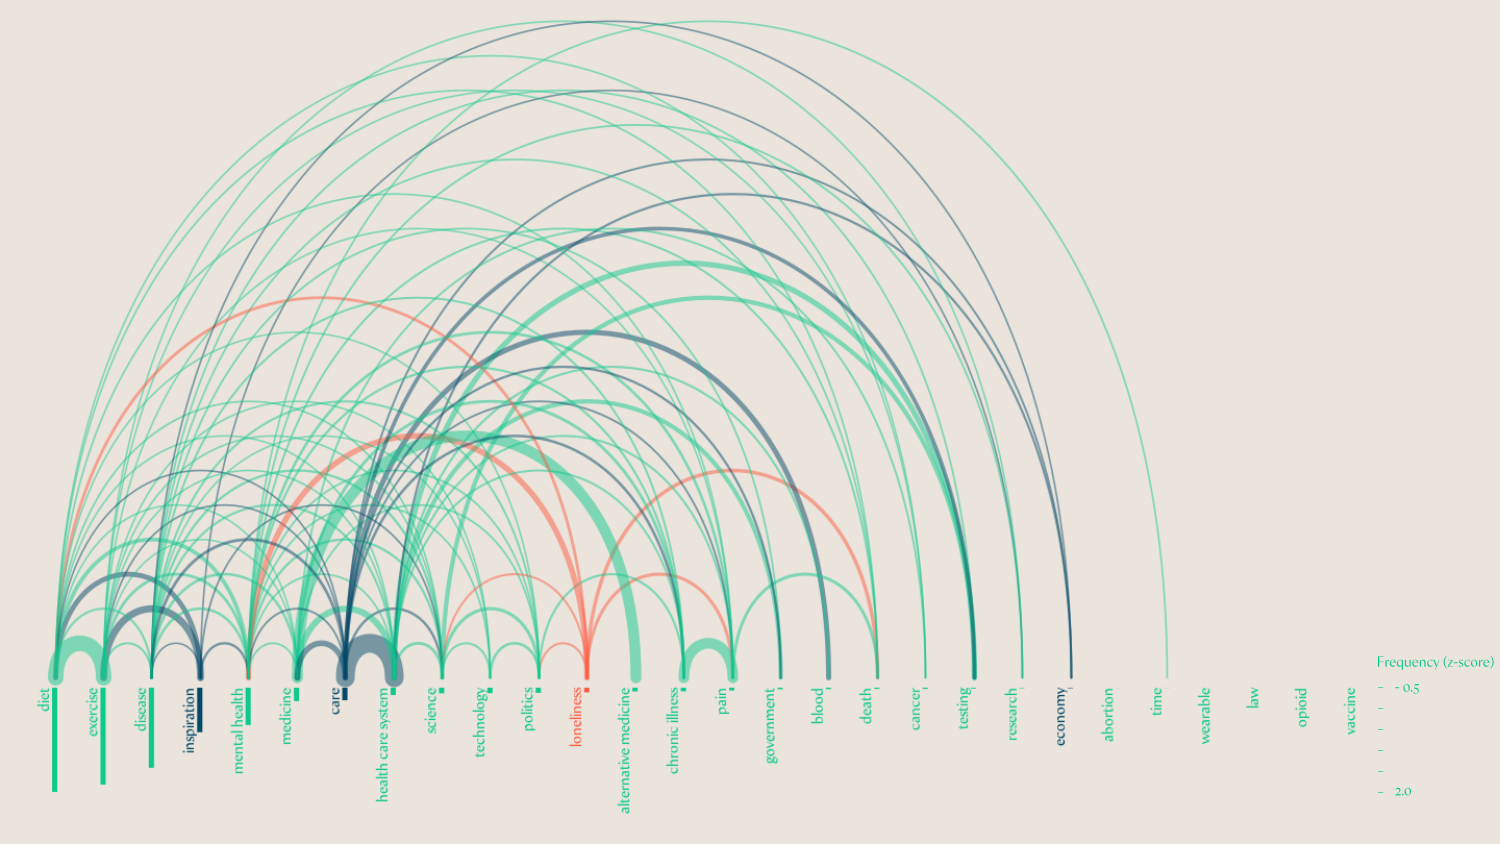
Everyday Health NLP
Natural language processing on social media to understand everday health during COVID.
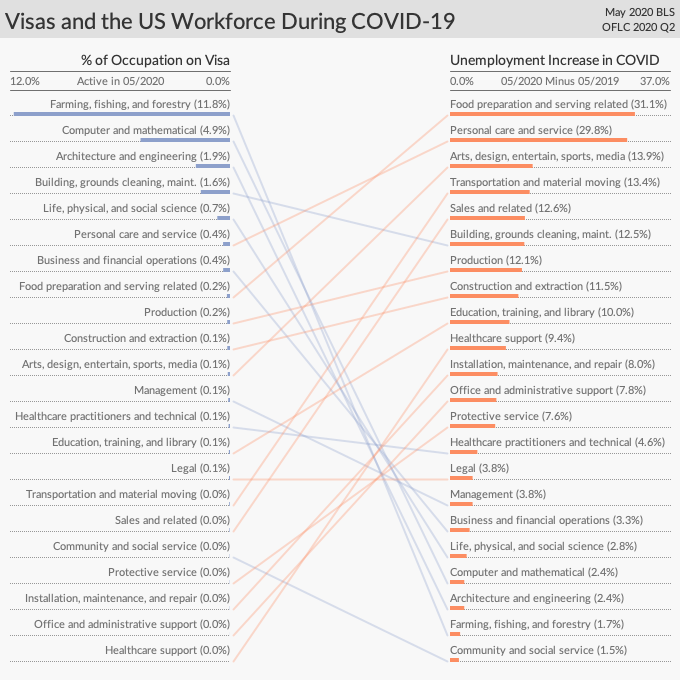
Work Visa Analysis
Why cutting work visas will not solve COVID unemployment
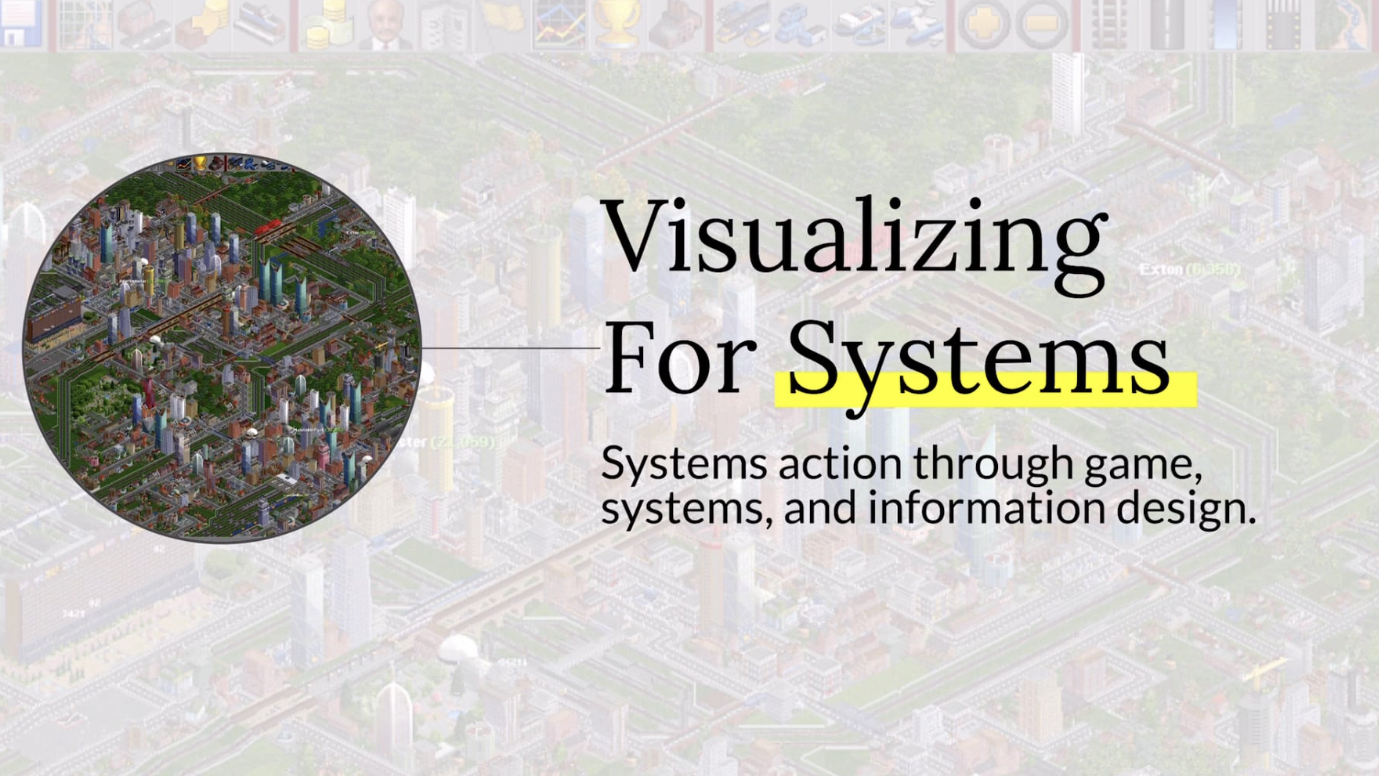
Visualizing for Systems
Talk given to a university systems design course.
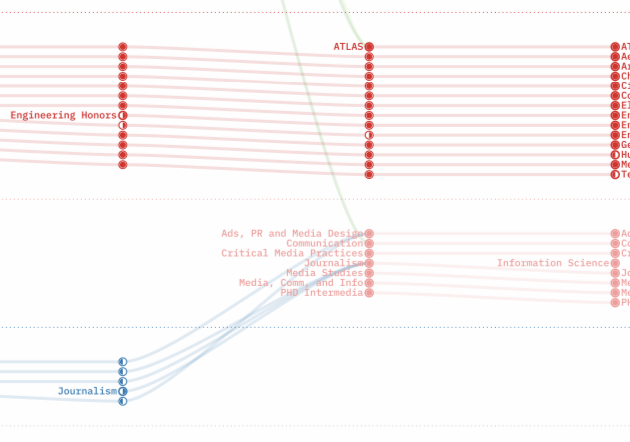
CU Course Timeline
Timeline of CU Boulder course catalog / schedule.
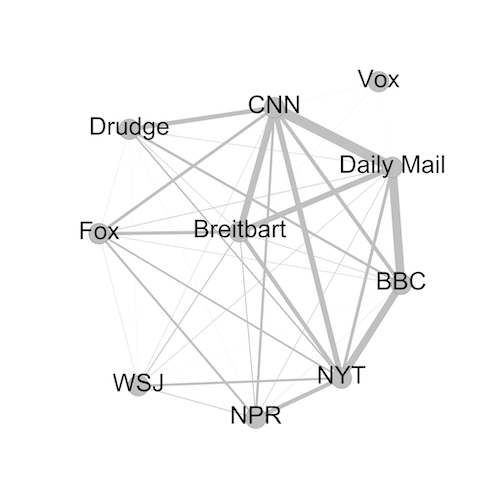
Who Wrote This
What does a neural network have to say about the news? Academic research and demo.
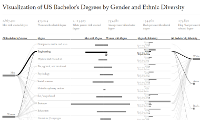
US Bachelors Degrees by Gender and Ethnicity
Visualization of US bachelor's degrees by gender and ethnic diversity. Browser-based written in d3.js.
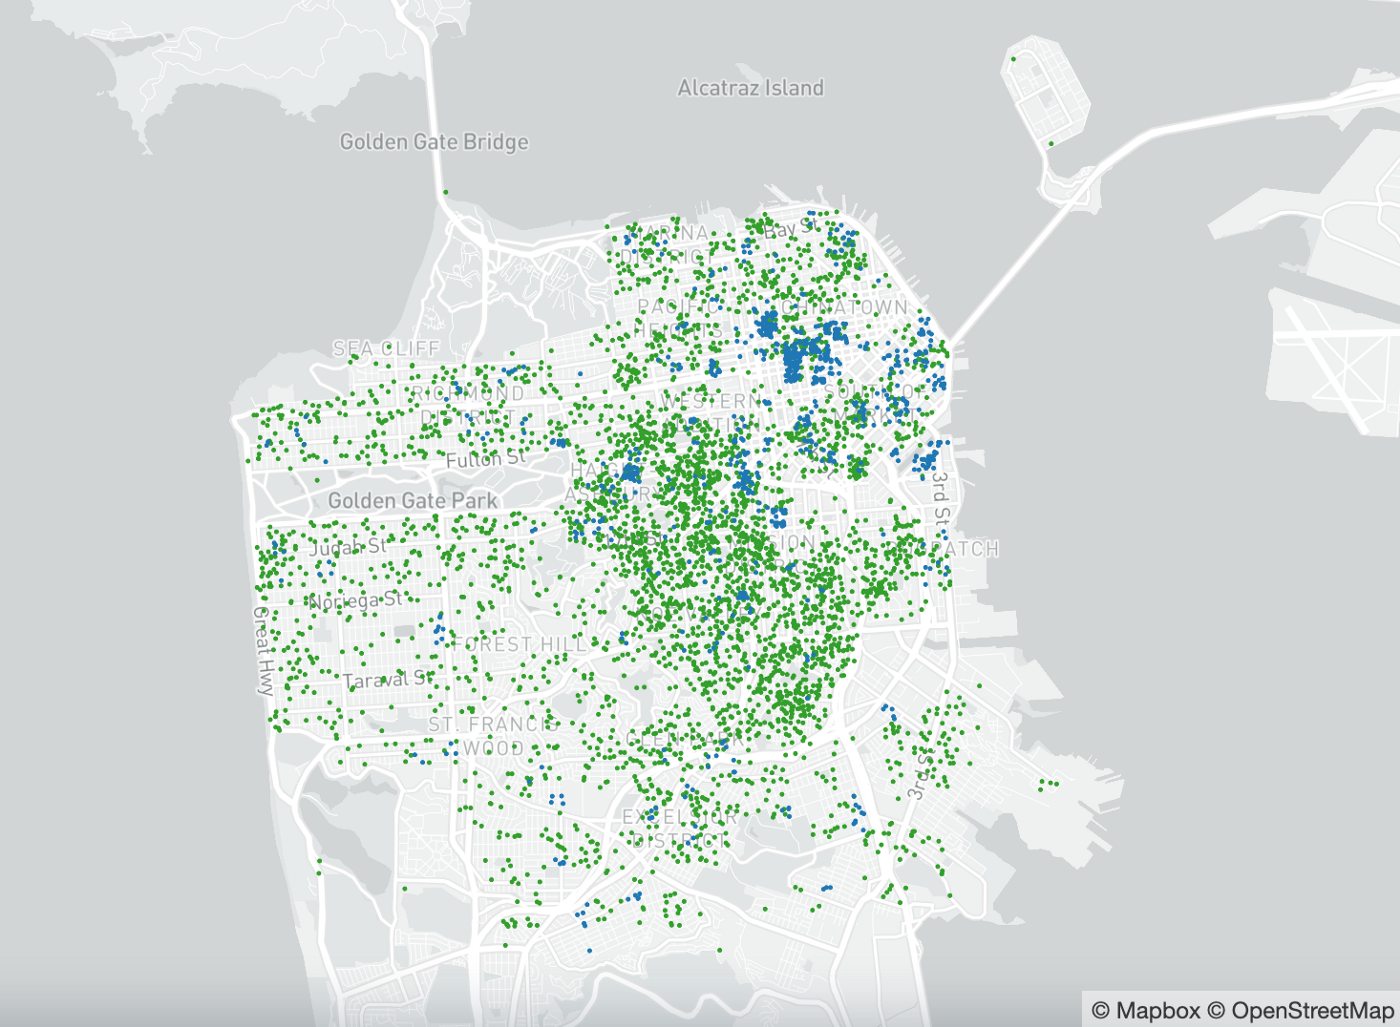
SF Airbnb Analysis
How does Airbnb impact housing in San Francisco? Analysis and data.
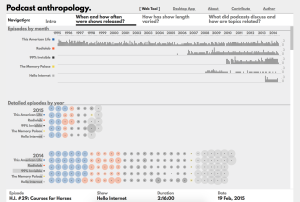
Podcast Anthropology
Visualization of podcast history and topics. Browser-based written in p5js.
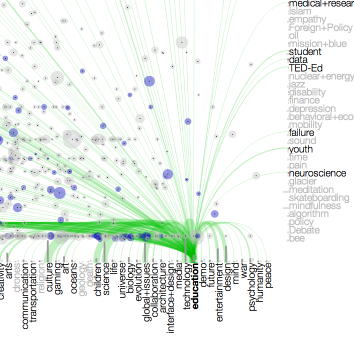
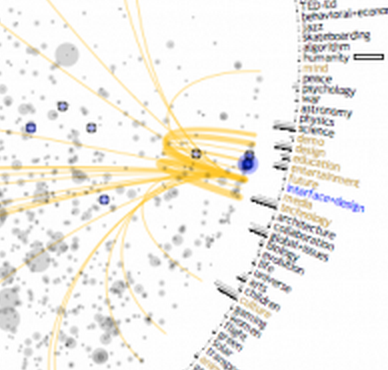
TED Visualization
Visualization of how ideas are interconnected as demonstrated by the TED conference. Browser-based written in d3.js.
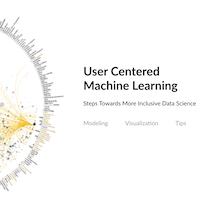
User Centered Machine Learning
Modeling and visualization techniques for addressing bias in machine learning, taking steps towards more inclusive data science.
Ant-inspired Resource Gathering Simulation
HTML5 canvas / JavaScript model of ant behavior as a self-optimizing resource gathering network.
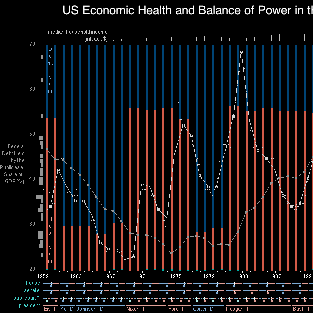
Economic Health and Political Balance
Visualization of US economic health and balance of power from 1959 to 2011. Static image.

CDIbase
CDIBase (open source) allows the CU Language Project and similar labs to access, manipulate, and collect research data securely online.
Analyze Boulder Census
Interactive visualization of the Analyze Boulder Census. In-browser / web-based application.
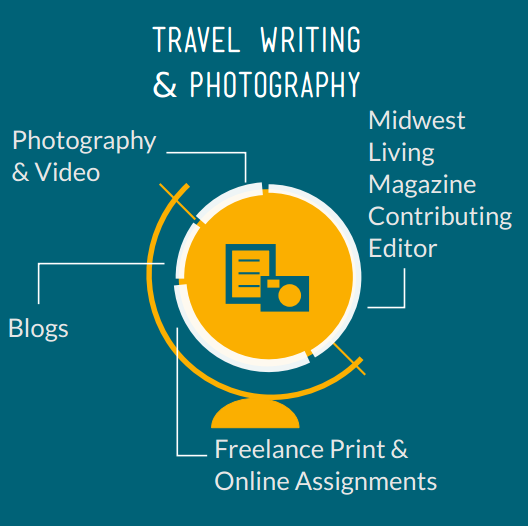
Kit Bernardi Infographics
Graphic design / infographics for an award-winning travel writer.
EHP Apply online
A flexible web application for academic admissions.
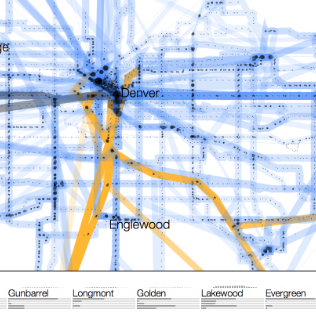
Colorado Income and Population through Public Transit
Where Colorado public transit goes, who uses it, access to mobility, distribution of population, and income levels throughout the state. d3.js web-based visualization.
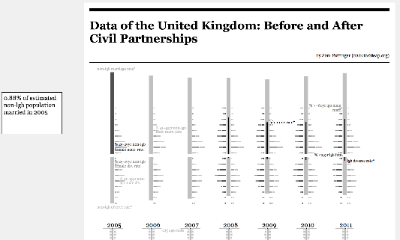
Data of the United Kingdom - Marriages and Civil Partnerships
Visualization and analysis of UK Marriage and Civil Partnership statistics. Browser-based (d3.js) with commentary. (prerelease)
TED Visualization (old)
Published visualization of the history of the TED conference. Desktop App.
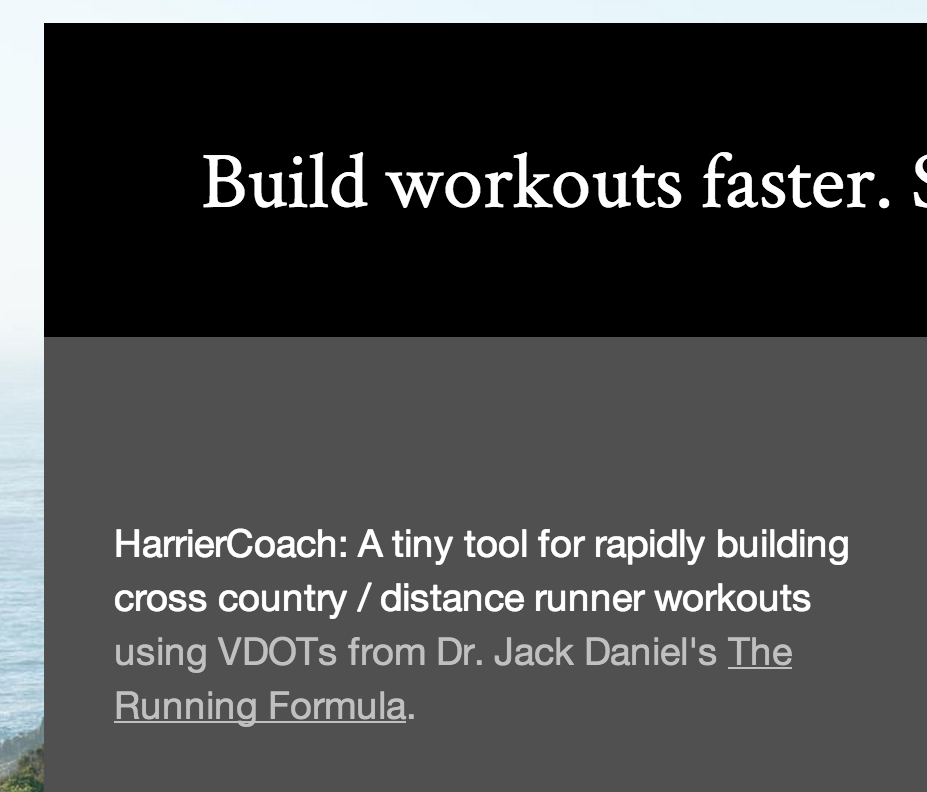
HarrierCoach
Custom tailored application generates color-coded running workouts from time trial information.
CU Language Project / Undergraduate Thesis
Cross-disciplinary undergraduate thesis on Techniques for Interactive Visual Exploration of Dynamic Linguistic Networks.
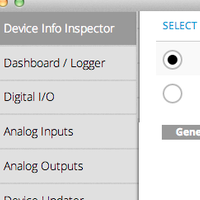
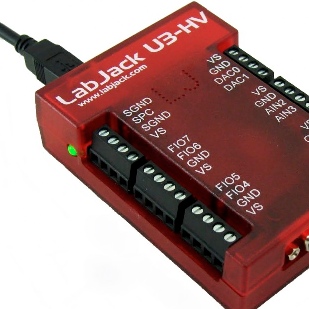
Kipling 3
Modular cross platform desktop application to manage LabJack devices.
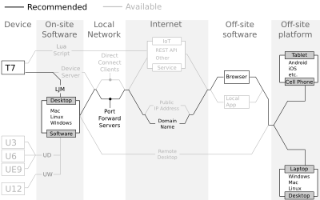
LabJack Use Cases Diagram
A succinct summary of all of the way to connect to and make LabJack devices available.
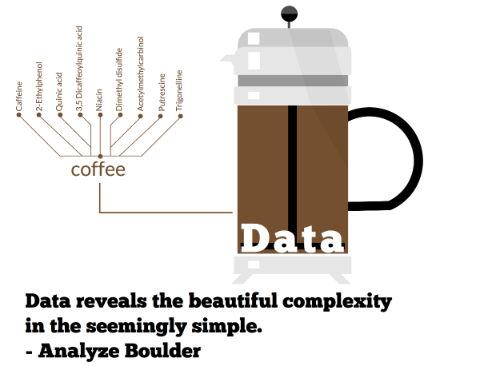
Analyze Boulder Flyer
Flyer made for Analyze Boulder, a Boulder, CO meetup for all things data and data science.
TRACER Analysis
Identity clustering (SVM) analysis of Colorado political campaign data.
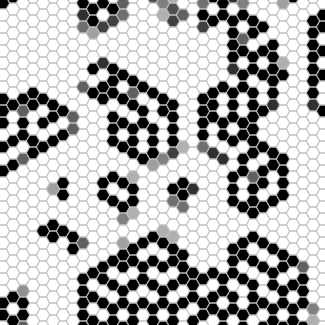
Hexagonal Population Game
HTML5 canvas / JavaScript hexagonal population variant on Conway's Game of Life.
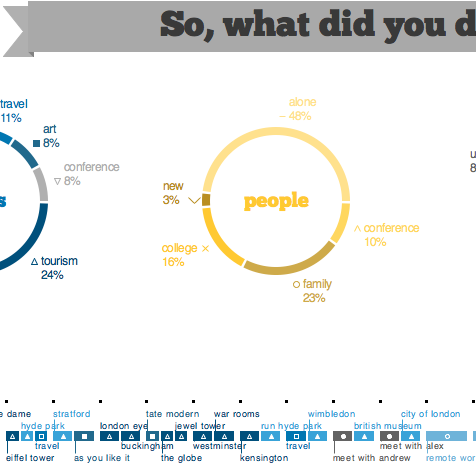
What Did You Do?
For fun visualization of my trip to London and Paris.
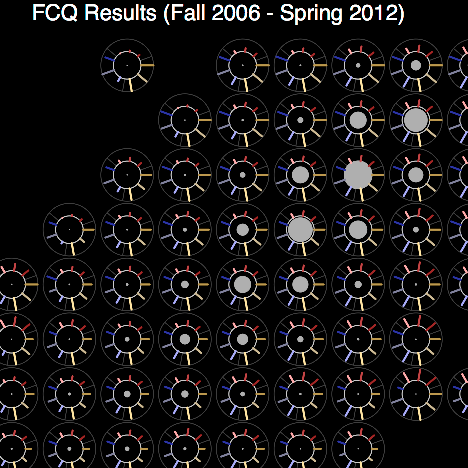
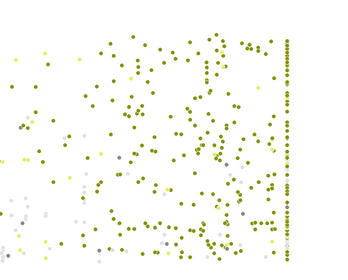
FCQ Visualization
Visualization of the Faculty Course Questionnaire dataset from the University of Colorado at Boulder.
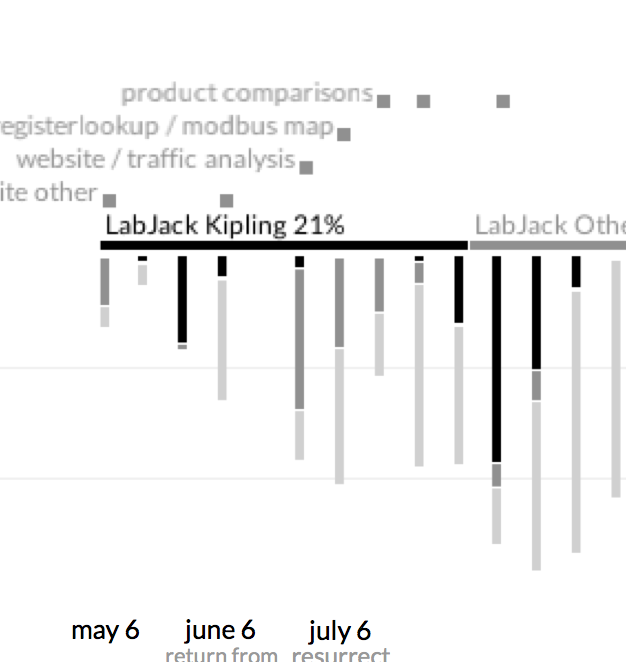
Contracting Hours Visualization
Visualizing almost a year of contracting.
opencampaigndata
Unofficial API for Colorado campaign finance data.
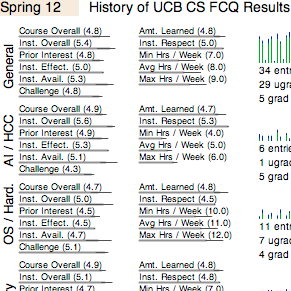
UCB CS FCQ History
Visualization of the history of FCQ results from the CS dept. at CU Boulder.
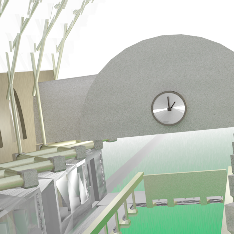
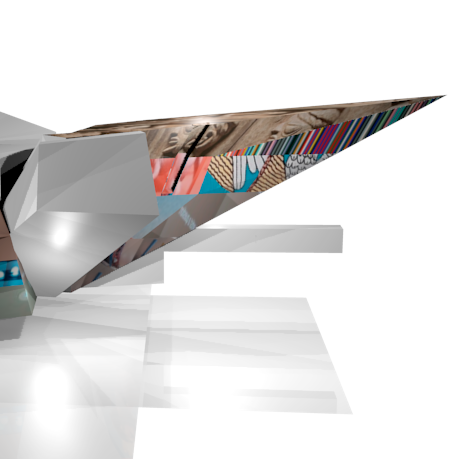
Before Tintern
Artistic rendering of a train station done in Blender.
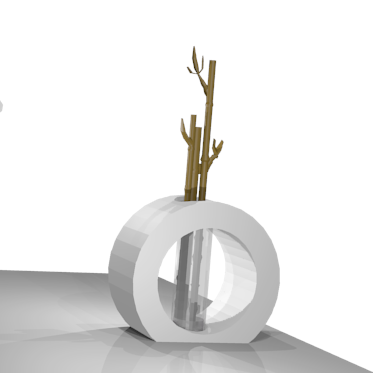
Denver Art Museum
Artistic rendering the Denver Art Museum done in Blender.
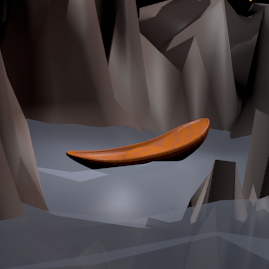
The Spiegelman
Artistic rendering of a small wooden boat done in Blender.
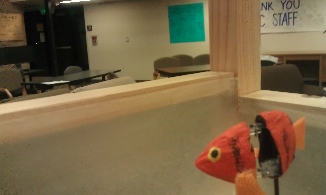
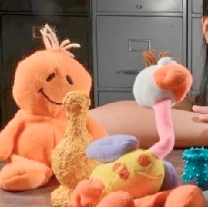
AutomataAquarium
Animatronic aquarium for Professor Eisenberg's Things that Think course.
Leopold the Lizard
Dancing mechanical lizard for Professor Eisenberg's Things that Think course.
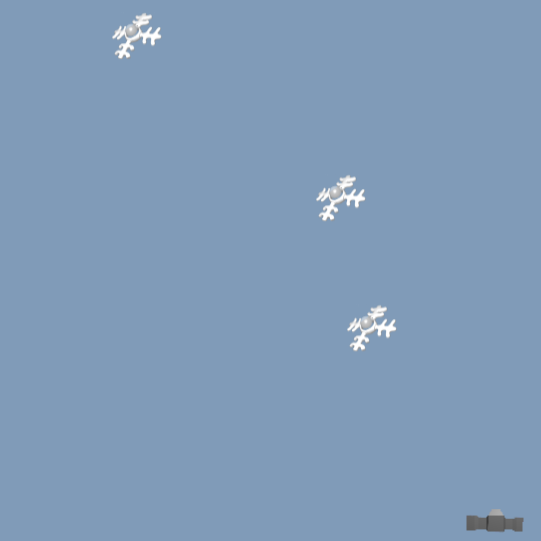
Snowfall
HTML5 game / demo that demonstrates jQuery combined with canvas and audio elements.
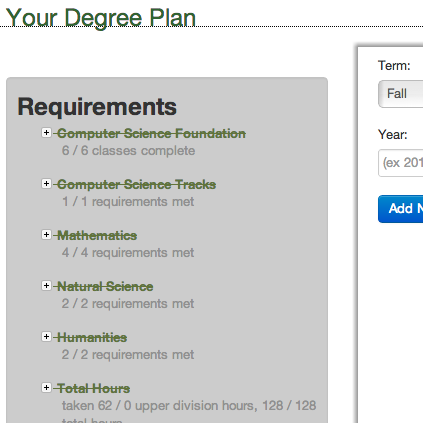
UCB CS Degree Planner
Web-based degree planner for computer science students at the University of Colorado at Boulder
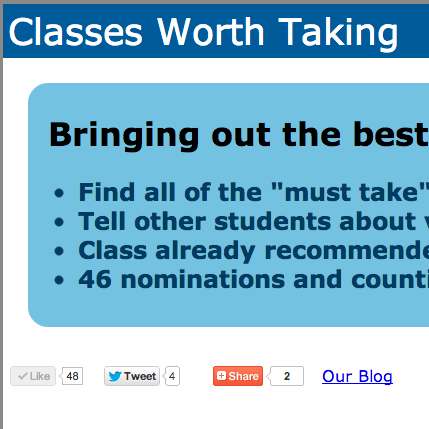
Classes Worth Taking
Simple voting-based web application that allows students to share classes they found worthwhile with their peers.
Gleap Alpha
Gleap provides SMS / web-based organizational tools for community service groups.

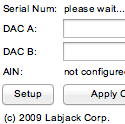
EI-1050 Testing Utility
EI-1050 testing and setup utility for LabJack devices.
LabJackPython
Provided programming assistance in building a Python library to control LabJack devices.
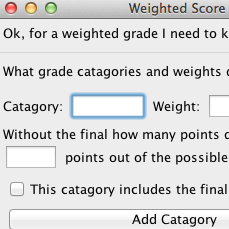
Panic Factor
Utility I developed for my high school classmates that calculates what score is needed on a certain assignment / exam to get a particular overall grade in a class.

Digital Media Test Kitchen
Worked with Steve Outing and Olga Kharitonova from CU Boulder's cross disciplinary Digital Media Test Kitchen on algorithmic Internet news credibility.
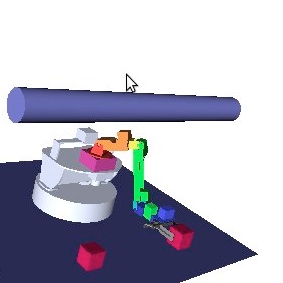
Andrews Robotics Initiative
Supported Professor Correll's graduate students by writing ROS packages for his lab's equipment.
SQUAD
Created a Python library to abstract low-level socket-based commands for the project's quadrotor helicopter and developed an online resource base for the team.