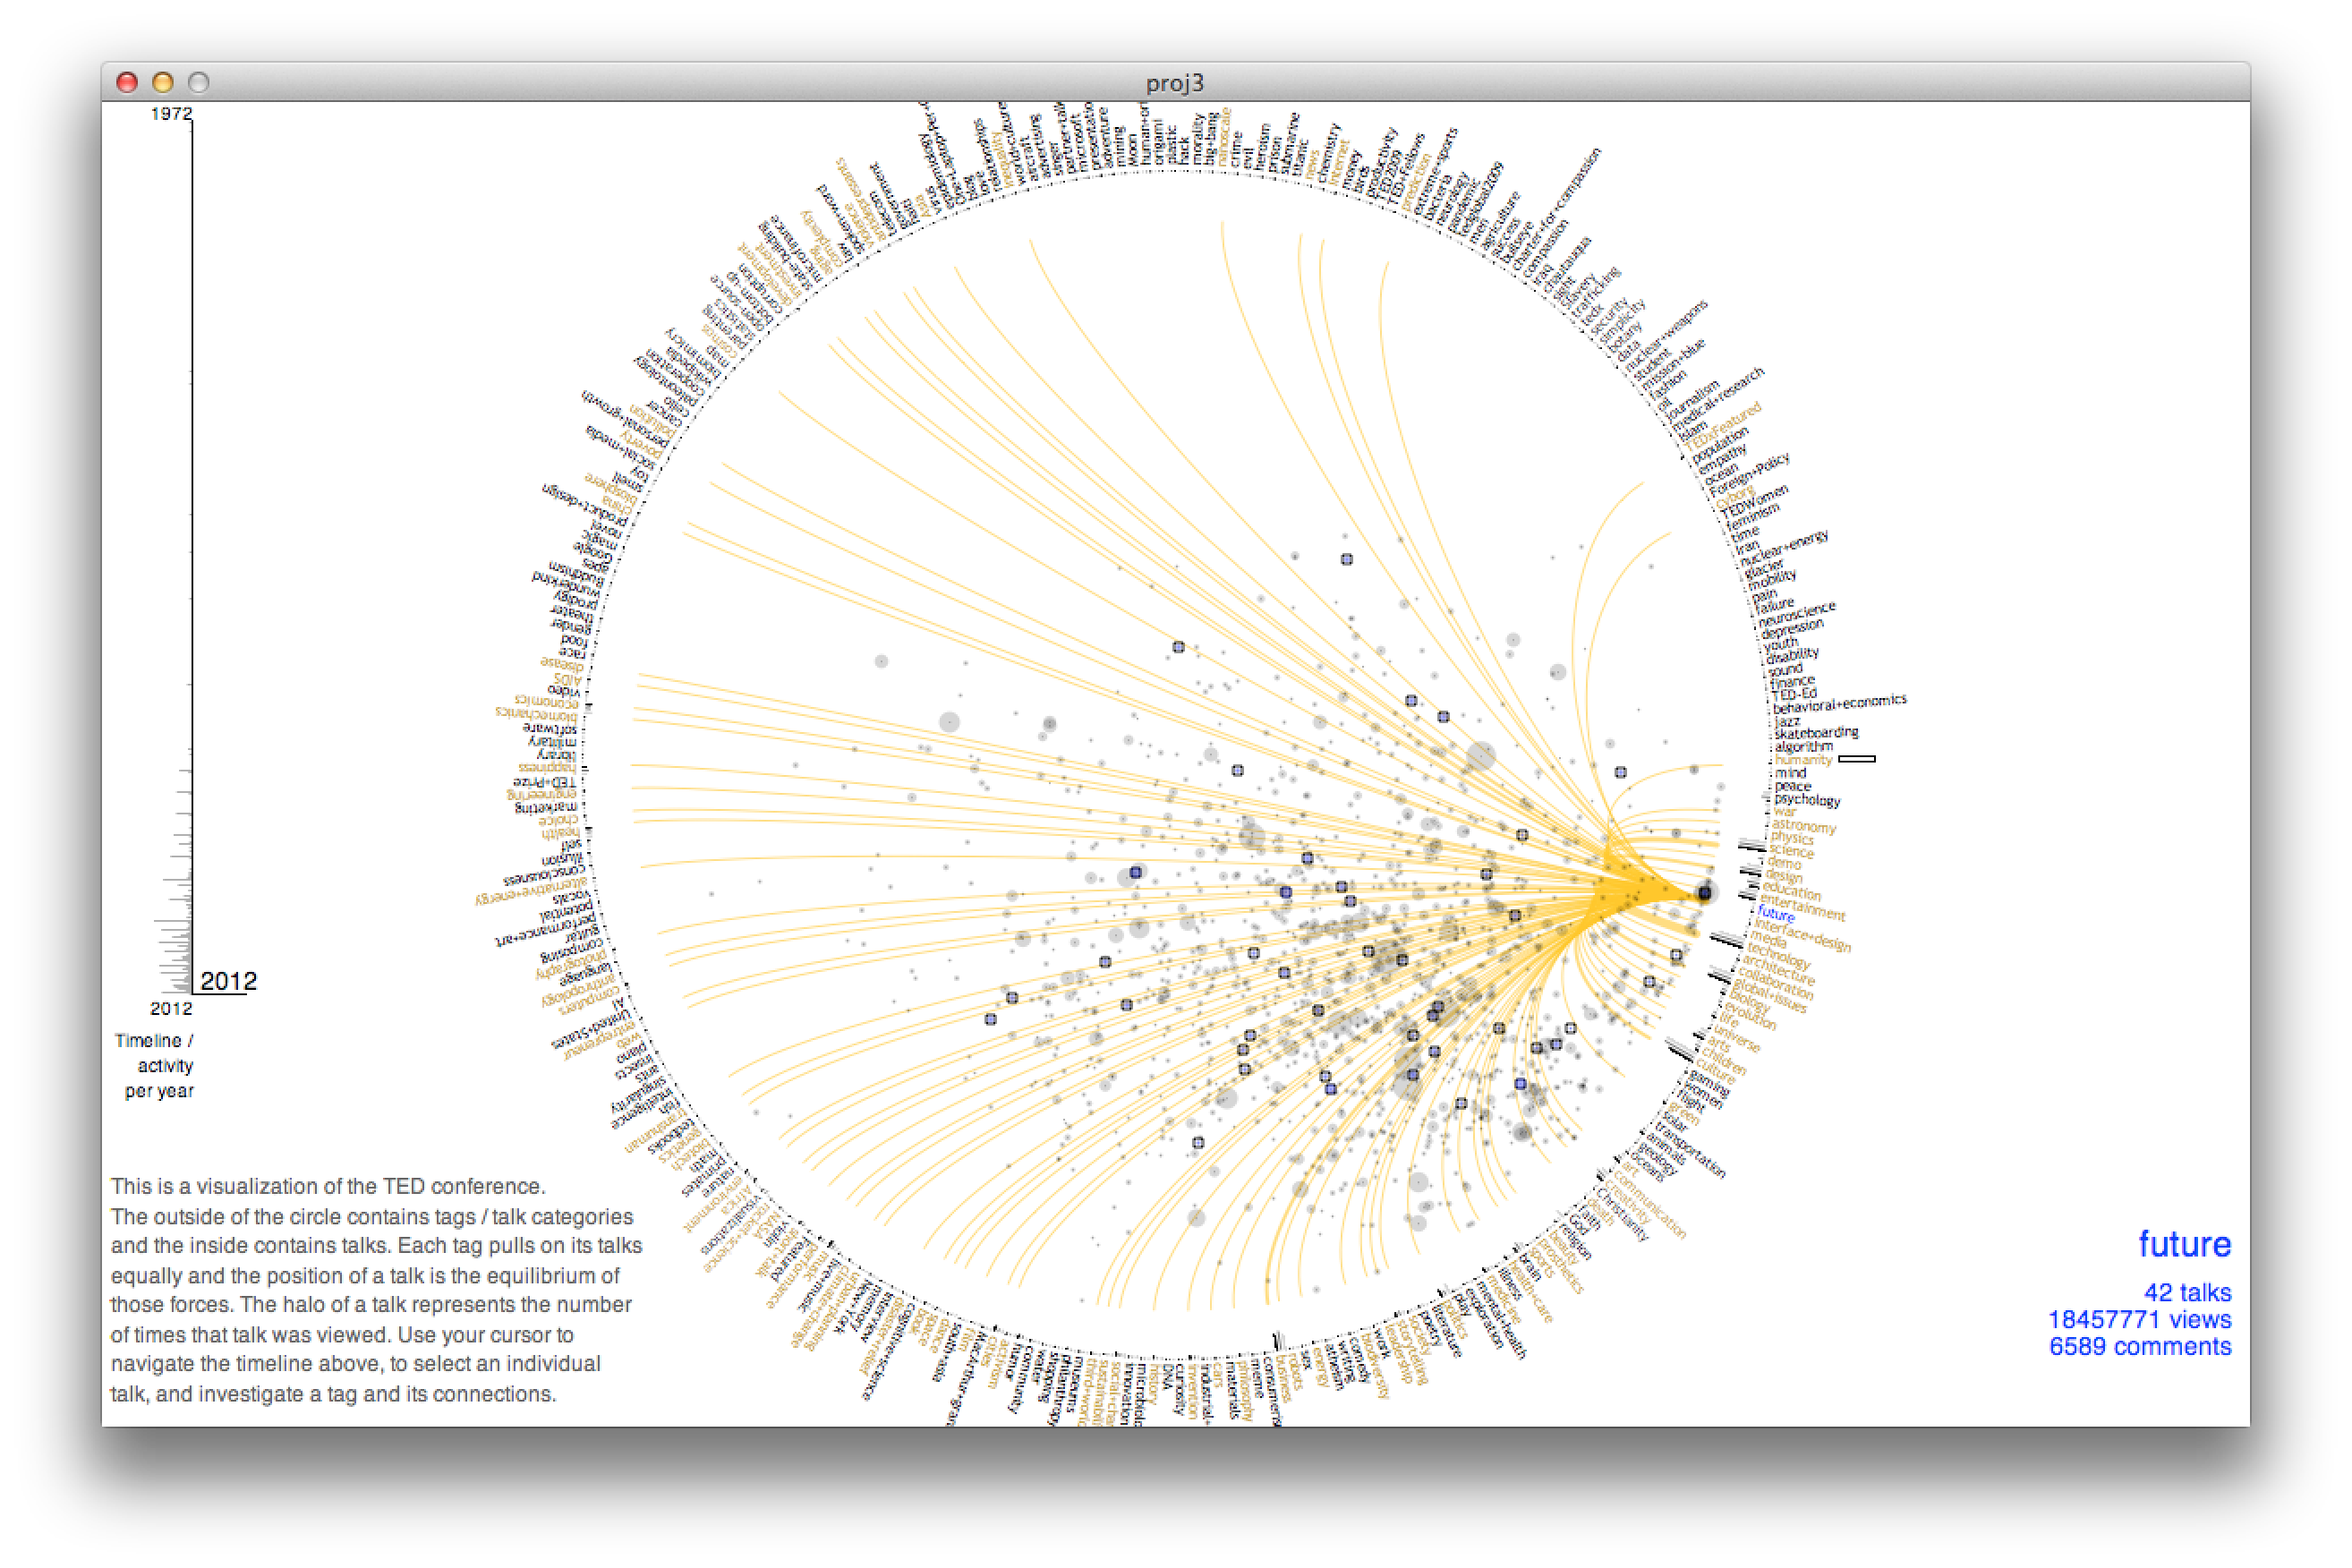
Published visualization of the history of the TED conference. Desktop App.

TED Visualization (old)
As a proxy for understanding the interconnectedness of ideas, this interactive visualization provides a lens into the growth and structure of the TED conference over time. Written in Processing. This is my first iteration of this visualization. See the new version at https://gleap.org/content/ted_visualization_2.
This visualization has been published in Markus Nix's latest book: Visual Simplexity