Visualizing almost a year of contracting.
Contracting Hours Visualization
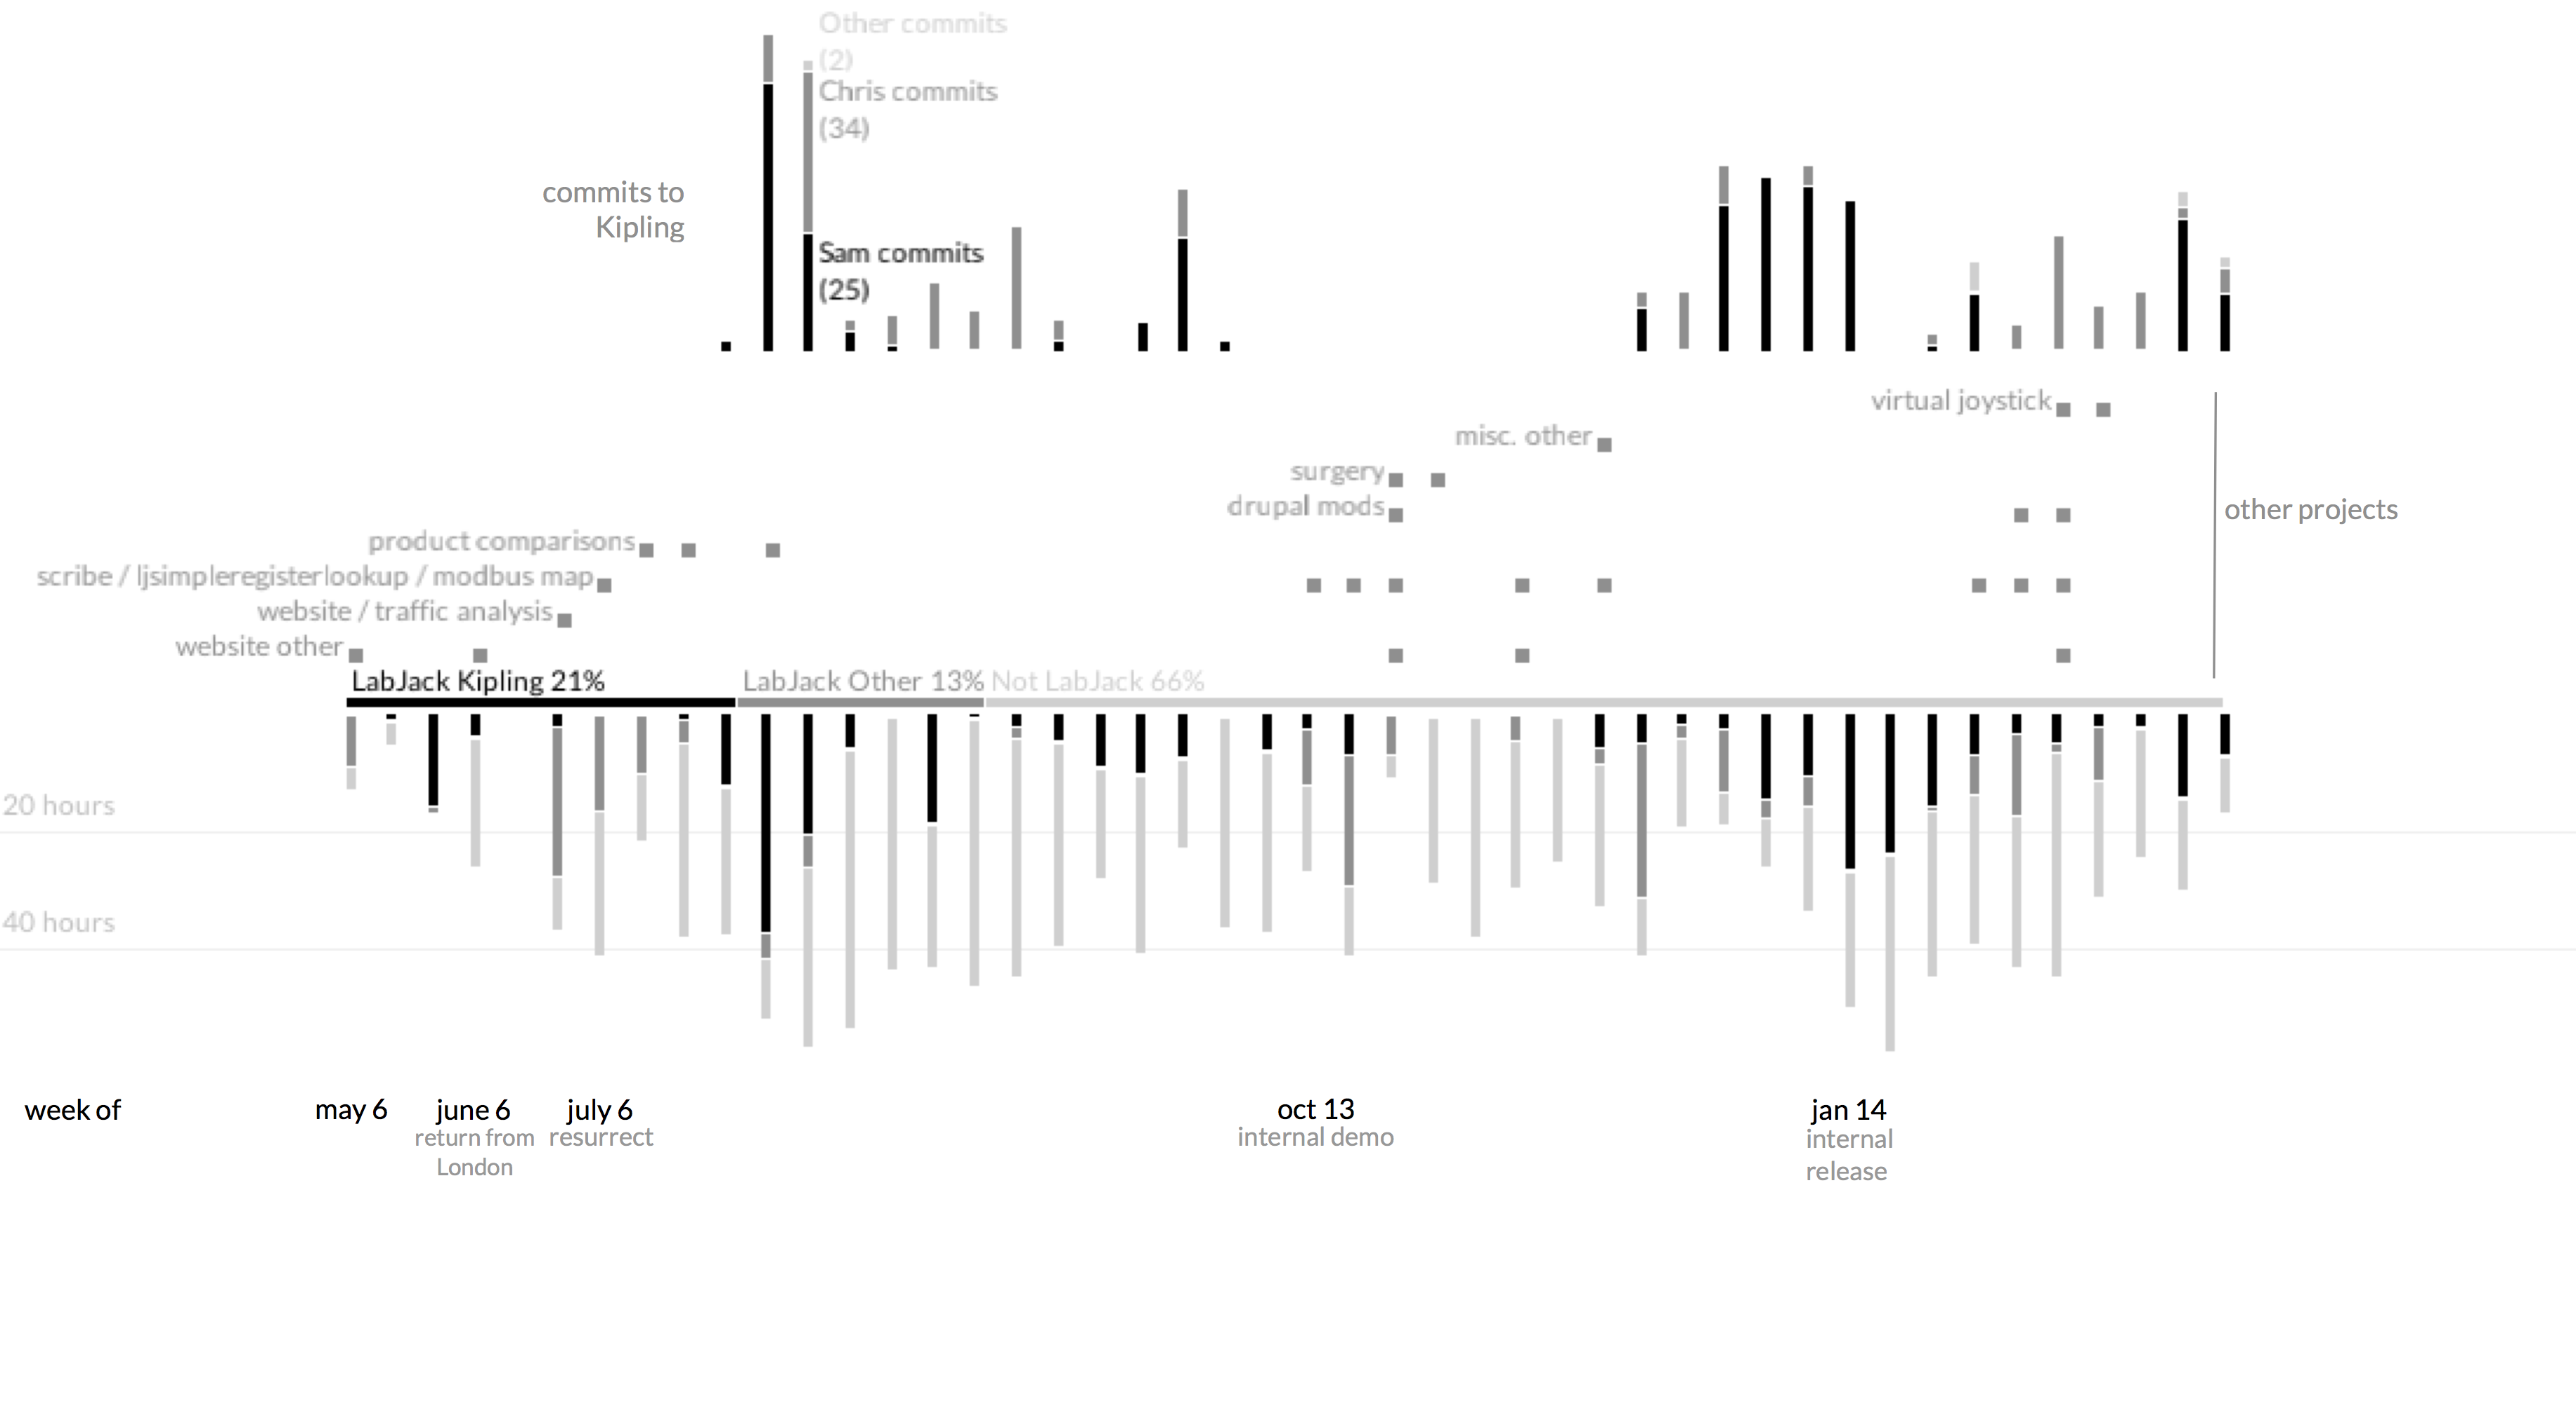
A very brief report showing the hours I worked on a major project for a client (LabJack) with git commits to that project on top, the periods in which I worked on other projects for the same client or had major personal events (like surgery) in the middle, and the percentages of my time worked for LabJack versus my other clients as well as a chronological overview of overall hours worked at the bottom. Very quick (sprint one might say) of a visualization but still hopefully interesting.