Visualization of how ideas are interconnected as demonstrated by the TED conference. Browser-based written in d3.js.
TED Visualization
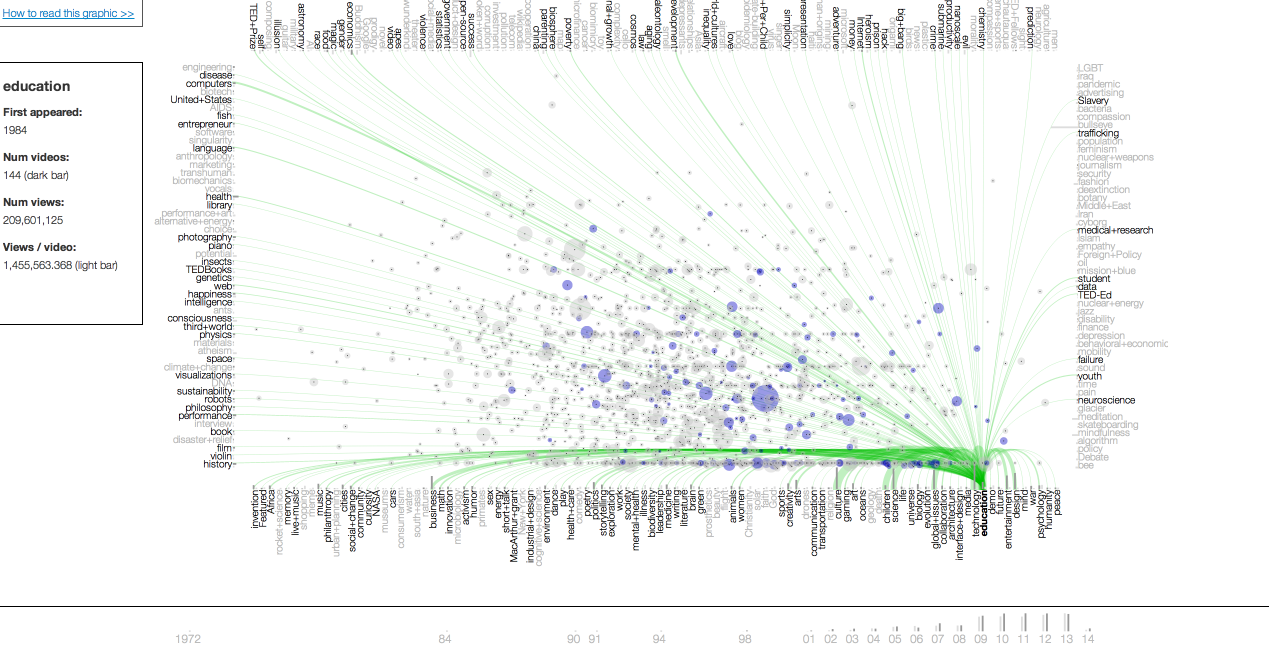
As a proxy for understanding the interconnectedness of ideas, this interactive visualization provides a lens into the growth and structure of the TED conference over time. Written in d3.js.
This is my second iteration of this visualization. The first ws published in Markus Nix's latest book, Visual Simplexity, and the original can still be found at https://gleap.org/content/ted_visualization.